
15 July 2026
Global Bizjet Activity
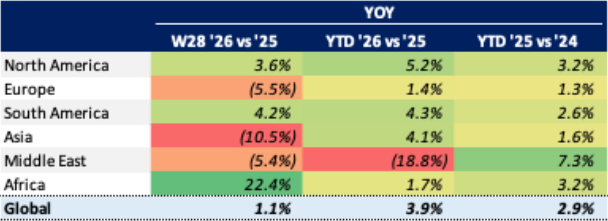
Global bizjet activity expanded sluggishly at +1.1% year-on-year in Week 28 (6 – 12 July), with the year-to-date figure through 12 July at +3.9% ahead of last year, a full 1.0 percentage point increase compared to the 2025 vs 2024 trend across the same dates. While accounting for only 1% of global bizjet traffic last week, Africa was the star performer, realizing 22.4% more bizjet activity than in Week 28 2025.
Chart 1: Global Bizjet Departures Trends YTD (1 January – 12 July)
Event Analysis: Allen & Co Sun Valley Conference Draws High Profiles to Idaho
*This week’s event analysis examines the business jet traffic for Allen & Co’s Sun Valley Conference
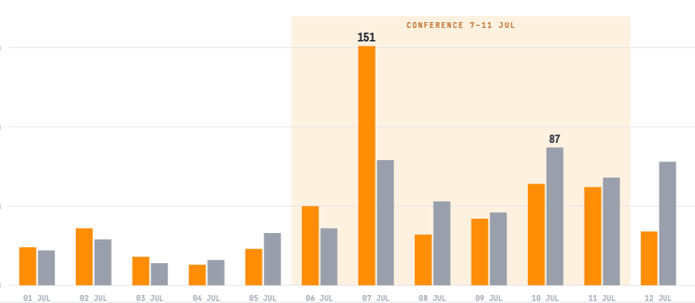
Sun Valley’s signature in-and-out shape was apparent this year, with 151 inbound business jets on Tuesday 7 July alone, as principals converged for the conference opening. Departures then built steadily across the week to a Friday 10 July peak of 87 and stayed elevated through the closing weekend, with 68 on Saturday and 78 on Sunday. The result was a clean front-loaded arrival wave and a back-loaded weekend exodus, the typical traffic pattern observed at high-end marquee events.
Chart 2: Daily business jet movements (arrivals + departures) at KSUN
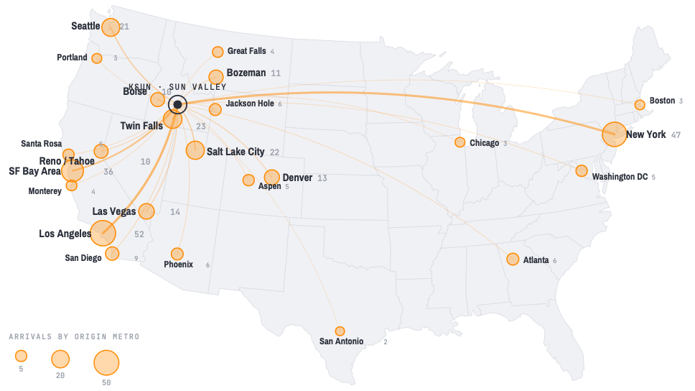
Los Angeles and New York dominated the inbound field, with the LA metro supplying 52 arrivals and the NYC metro supplying 47. The San Francisco Bay Area added another 36, with the technology sector’s hub sending its share of attendees to the north of Idaho.
Chart 3: Sun Valley business jet arrivals by origin city
Regional Performance Analysis
North America
The North American market expanded 3.6% last week year-on-year, with the US overperforming compared to the region’s overall trend, at +4.2%. Amongst top US states, Week 28 trends were positive. California and Texas both realized 4.3% growth, while Florida expanded 2.6%.
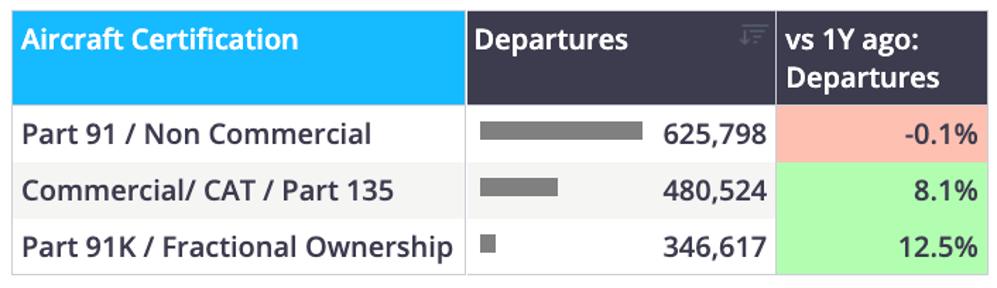
Chart 4: US business jet flights by aircraft certification YTD (1 January – 12 July)
Europe
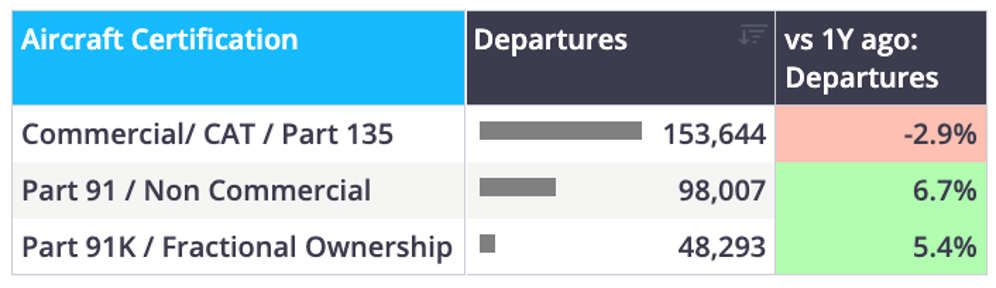
European business jet activity contracted 5.5% in Week 28, with most of the region’s top countries also declining. Switzerland was the sole top country to see growth last week, up 5.1%. Italy declined the least, -4.2%, then France at -4.7%, followed by the UK at -8.7%, finally with Germany declining 10.8%
Chart 5: Europe business jet flights by aircraft certification YTD (1 January – 12 July)
Rest of World
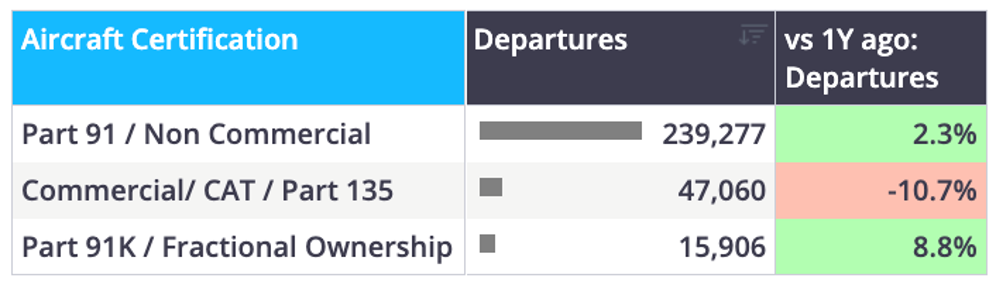
Business jet activity in regions outside of Europe and North America declined 0.7% on an aggregate basis, while trends varied widely by region. Africa led Week 28 growth at 22.4%, followed by South America’s growth of 4.2%, while the Middle East declined 5.4%, and Asia declined 10.5%. It should be noted that the Middle East appears to be on a solid recovery trend, while still down sharply year-to-date, weekly growth rates are slowly improving.
Chart 6: ROW business jet flights by aircraft certification YTD (1 January – 12 July)
Nick Koscinski, WINGX Analyst, comments: “Sun Valley is the same story every July and this year is no different, everyone flies in on Tuesday and heads home over the weekend. We counted more than 150 arrivals on Tuesday alone, with LA and New York supplying nearly 100 arrivals throughout the week.”
In collaboration with JETNET, WINGX Managing Director Richard Koe and WINGX Analyst Nick Koscinski have developed the new recurring JETNET iQ Market Monitor report. The report sets out to provide market analysis across all JETNET Group coverage of business jet inventory, market, and flight activity. Please reach out to nick@wingx-advance.com for your copy of the report.
*For this week’s event analysis, WINGX has provided an analysis for the 2026 Allen & Co. Sun Valley Conference using our proprietary AI prompts
