
24 June 2026
Global Bizjet Activity
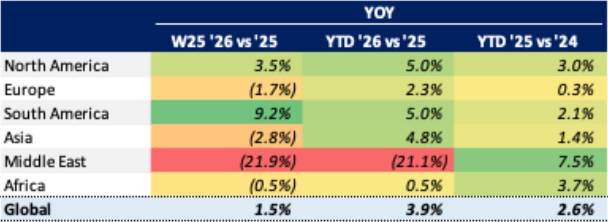
Global bizjet activity expanded modestly 1.5% year-on-year in Week 25 (15 – 21 June), with the year-to-date figure through 21 June at +3.9% ahead of last year, a notable increase compared to the 2025 vs 2024 trend across the same dates. While accounting for 3% of all bizjet sectors flown last week, South America saw the strongest YOY growth, with sectors up by 9.2% vs Week 25 2025, while the Middle East remains more than 20% below YTD 2025 levels.
Chart 1: Global Bizjet Departures Trends YTD (1 January – 21 June)
Event Analysis: World Cup Lifts Bizjet Demand, But The Surge Skips the Mega-Hubs For Now
*This week’s event analysis looks at the opening days of the 2026 FIFA World Cup and the attendant surge in business jet traffic to nearby airports
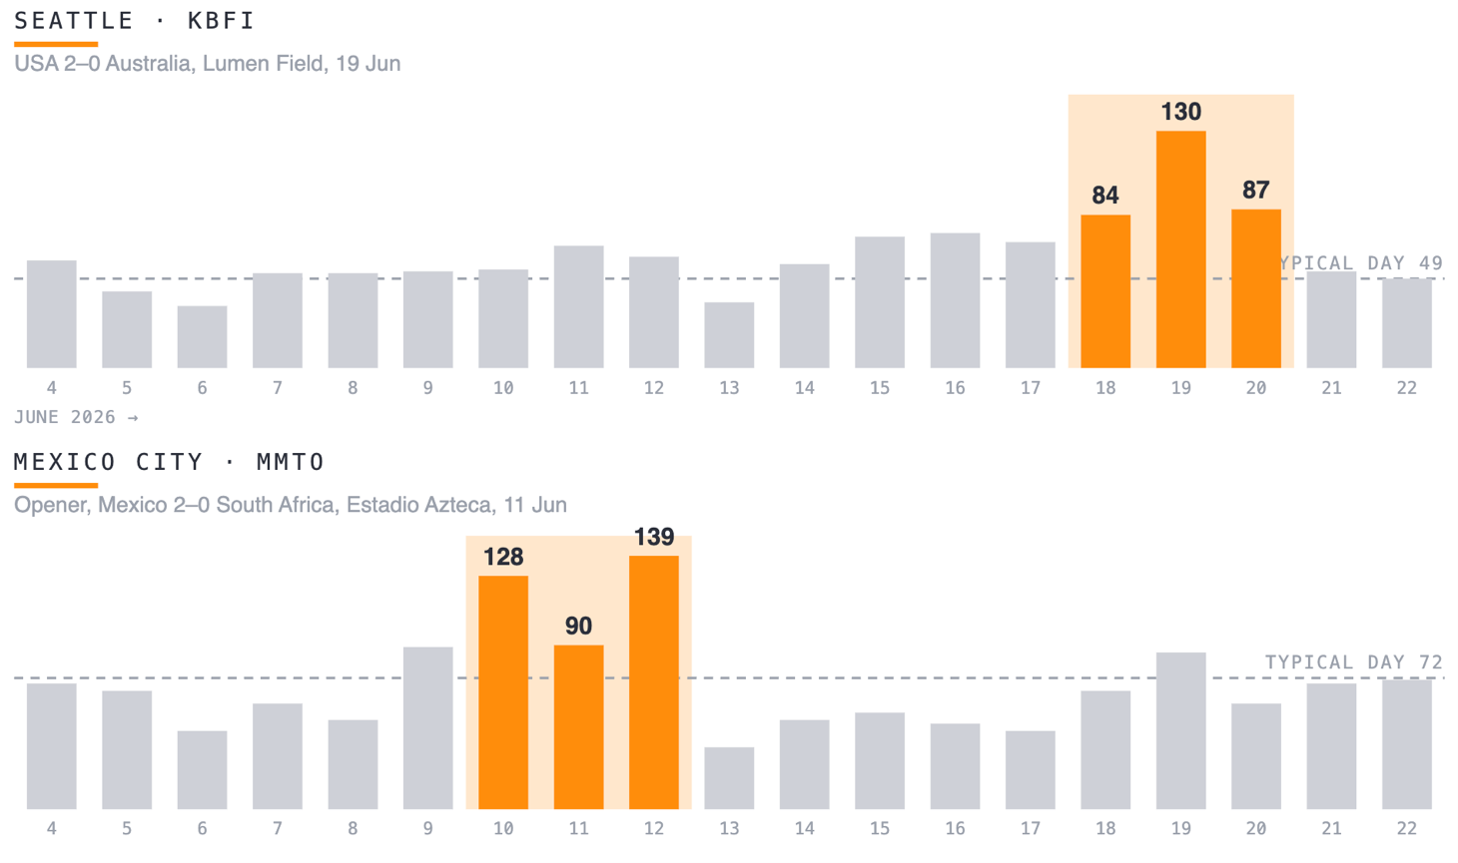
The opening days of the FIFA World Cup (11 – 22 June) delivered a clear, but uneven, boost to business jet traffic across the 16 host cities. Measuring movements in each market’s match window (day before, day of, and day after match), against a typical day, the sharpest surges landed not at the largest hubs, but at smaller markets. Seattle roughly doubled its normal daily activity for the USA – Australia match on 19 June, while Mexico City ran about 1.7x through the tournament opener, including a heavy day-after departure wave as the crowd cleared out of Estadio Azteca.
Chart 2: Daily business jet movements (arrivals and departures) at Seattle (KBFI) and Mexico City (MMTO)
Regional Performance Analysis
North America
The North American market expanded 3.5% in Week 25 and is now up 5.0% for the year through 21 June. The key US market performed even better last week, at +3.7% compared to W25 2025, while up 5.2% year-to-date. On a key state level compared to Week 25 2025, Florida expanded 3.9%, Texas grew 3.2%, while California rose 2.3%.
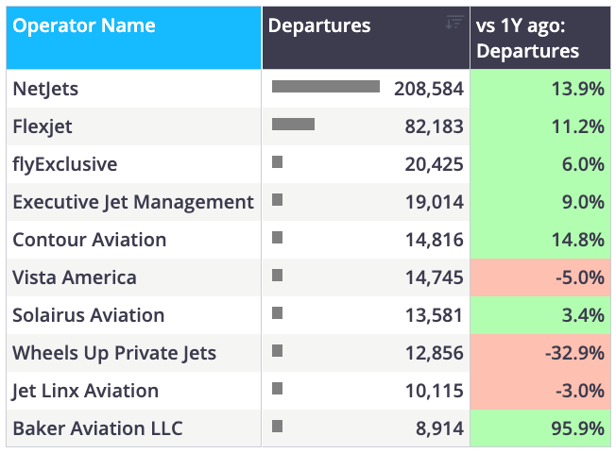
Chart 3: US business jet flights by top operators YTD (1 January – 21 June)
Europe
European business jet activity contracted 1.7% in Week 25, while the region saw various growth trends across top countries. Germany was the standout regional market last week, seeing the strongest growth at +10.4%, trailed behind by the UK with 2.2% Week 25 YOY growth. Amongst other key countries, France declined the least, -3.9%, Italy declined 5.9%, while Switzerland realized a notable double-digit contraction of 14.4%.
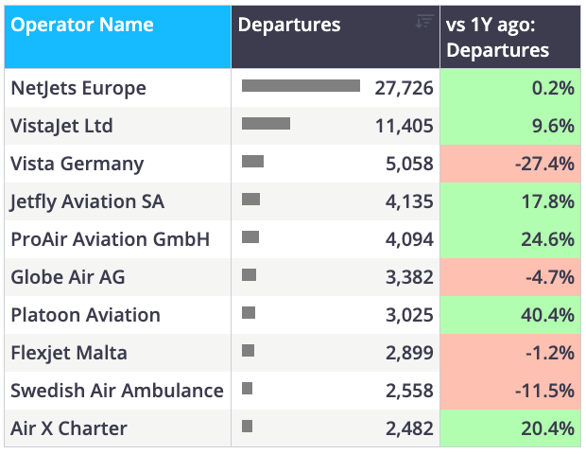
Chart 4: Europe business jet flights by top operators YTD (1 January – 21 June)
Rest of World
Business jet activity in regions outside Europe and North America continue to be dragged down on the aggregate due to the Middle East conflict. The region as a whole was down 3.1% Week 25 year-on-year, while various growth trends emerged per region. South America was the lone ROW region to realize Week 25 YOY gains, up 9.2%, followed by Africa, which slightly declined 0.5%, with Asia contracting 2.8%, while the Middle East was down 21.9%.
Chart 5: ROW business jet flights by top operators YTD (1 January – 21 June)

Middle East Weekly Evolution Tracker
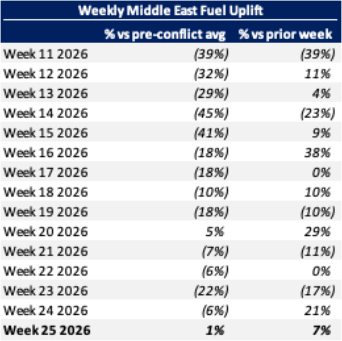
WINGX estimated fuel uplift data continues to provide the clearest lens through which to measure the cumulative and weekly toll of the conflict on Middle East business aviation. The WINGX pre-conflict baseline is Weeks 7 – 10 (9 February – 8 March). While the conflict outbreak occurred on 28 February in Week 9, the material impact on jet fuel pricing did not begin to be felt until the week of 9 March (Week 11), meaning Weeks 7 – 10 captures operating conditions before the fuel cost shock began cascading through the market. Across those four weeks, Middle East bizjet activity averaged 1.5M USG of estimated fuel uplift per week, establishing the baseline against which subsequent weeks in the table below are measured.
Chart 6: Weekly Middle East bizjet fuel uplift trends pre vs post conflict
Nick Koscinski, WINGX Analyst, comments: "As expected, the World Cup is bringing in a surge of bizjet traffic to nearby airports of the host cities. Although, the smaller markets are seeing a much more sizeable surge in traffic, whereas large metros like New York or LA see the extra jets just blend into an already busy month. With the knockout rounds still to come, we expect to start to see bigger spikes to follow, with the final match delivering the largest surge of them all."
In collaboration with JETNET, WINGX Managing Director Richard Koe and WINGX Analyst Nick Koscinski have developed the new recurring JETNET iQ Market Monitor report. The report sets out to provide market analysis across all JETNET Group coverage of business jet inventory, market, and flight activity. Please reach out to nick@wingx-advance.com for your copy of the report.
*For this week’s event analysis, WINGX has provided a surge analysis for the 2026 FIFA World Cup host city airports using our proprietary AI prompts
Continue reading free
Enter your email to unlock this article and get the WINGX Bulletin delivered to your inbox, weekly.
