
23 July 2026

Please come and join our webinar Friday 1300 ET where we will be reviewing the status and outlook of the business aviation industry after the first half of 2026. Register here to secure your place.
Global Bizjet Activity
Global bizjet activity contracted 2.7% year-on-year in Week 29 (13 – 19 July), with the year-to-date figure through 19 July at +3.7% ahead of last year, a 0.2 percentage point reduction compared to the YTD trend report last week, though a notable increase compared to the 2025 vs 2024 trend across the same dates. While accounting for only 1% of global bizjet traffic last week, Africa was the only region to experience YOY growth, seeing 6.3% more bizjet activity than in Week 29 2025.
Chart 1: Global Bizjet Departures Trend YTD (1 January - 19 July)
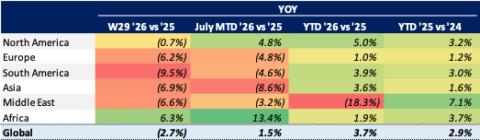
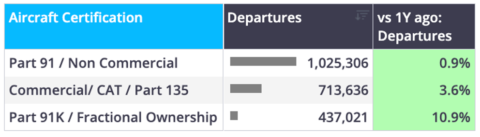
Chart 2: Global Bizjet Departures Trend YTD (1 January - 19 July) by Aircraft Certification
Event Analysis: Business Jets Pack the Wittman Ramp for Oshkosh
*This week’s event analysis examines business jet traffic for the 2026 AirVenture at Oshkosh
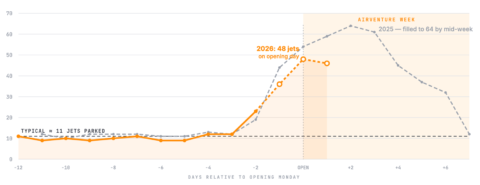
Wittman Regional Airport’s (KOSH) parked business jet number runs at about 10 on a normal day, but during the start of AirVenture this week it reached 48 on the opening Monday, close to 5x its usual daily level. The increase is quite steep and obvious, as the ramp sat near baseline through mid-July before arrivals started to pile in over the weekend ahead of Monday’s opening day. Looking at last year as the guide for what could be coming in the next few days, in 2025 the same ramp filled to a peak of 64 by mid-week before dropping back to normal once the show concluded. 2026 appears to be tracking broadly in line with last year, meaning the busiest days are most likely still ahead.
Chart 3: Daily parked business jets at Wittman Regional Airport (KOSH) for AirVenture at Oshkosh
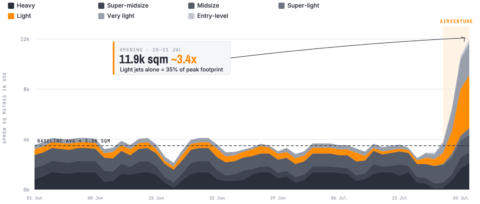
Weighting each parked jet by its footprint shows what kind of metal is doing the filling, with stand space in use climbing from its typical ~3.5k square meters to almost 12k square meters on opening day, around 3.4x the baseline. The growth is primarily driven by smaller jets, with light jets alone accounting for 35% of the peak footprint. With the last few days of the event still to come, the apron should continue to fill, before the exodus upon conclusion of AirVenture 2026.
Chart 4: Daily ramp space occupancy (square meters) at Wittman Regional Airport (KOSH) for AirVenture at Oshkosh
Regional Performance Analysis
North America
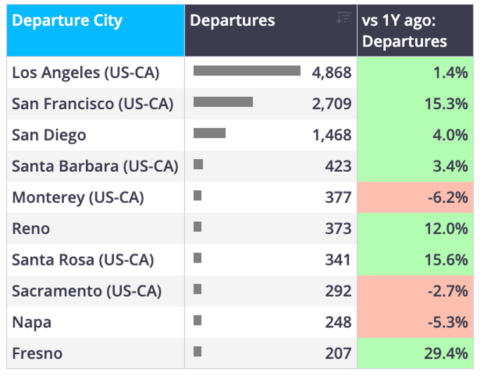
The North American market contracted 0.7% last week year-on-year, with the US realizing a flat week with no growth or declines. Amongst top US states, Week 29 trends were varied. Texas saw 8.0% more traffic, while Florida was flat, and California declined 5.0%.
Despite North America contracting last week, New York City saw a strong surge for the World Cup final on 19 July. During the 18 – 20 July window, there were more than 1,600 business jet arrivals into NYC, which was a 41% increase compared to 18 – 20 July period last year. A full World Cup surge analysis will be released next week.
Chart 5: California business jet flights by top cities MTD (1 – 19 July)
Europe
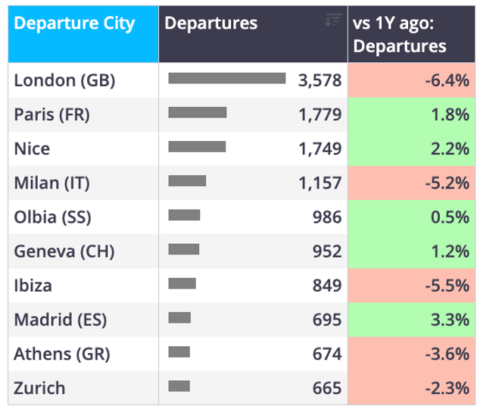
European business jet activity contracted for another consecutive week, with bizjet traffic down 6.2% in Week 29, with all of the region’s top countries also declining. Germany declined the least at -4.0%, followed by Switzerland at -4.4%, then France with a 9.1% reduction, Italy contracting 10.5%, and finally the UK dropping 11.3%.
Chart 6: Europe business jet flights by top cities MTD (1 – 19 July)
Rest of World
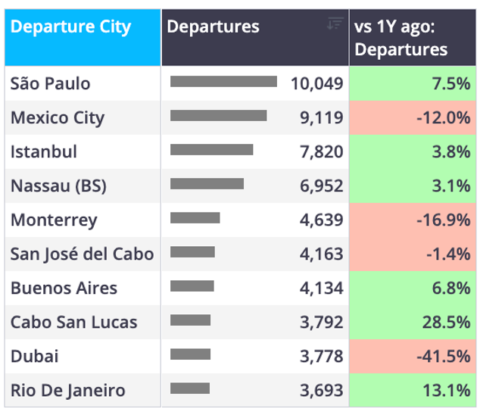
Business jet activity in regions outside of Europe and North America declined 6.2% on an aggregate basis, while trends were mostly down by region. Africa was the lone region to see Week 29 growth, expanding 6.3%, with the Middle East, Asia, and South America regions all declining last week, -6.6%, -6.9%, and -9.5% respectively.
Chart 7: ROW business jet flights by top cities YTD (1 January – 19 July)
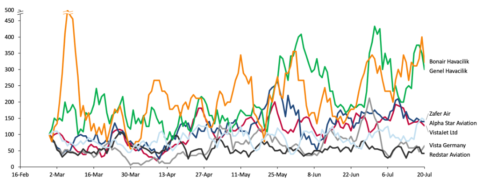
The Middle East is showing tentative signs of recovery, with weekly YOY declines improving from 20%+ a few weeks ago, to the 5-7% range seen in recent weeks. This recovery is highly variable and volatile on a per operator basis. This is evident when looking at some of the top Middle East business jet operators and comparing their 5-day average departures to the average departures from 23 – 27 February prior the conflict starting. Some operators are flying more in recent weeks compared to before the conflict, whereas others are still highly subdued.
Chart 8: Middle East business jet flights by top operators’ recovery since start of conflict. Rolling 5-day average departures index: 23 – 27 February Average = 100
Nick Koscinski, WINGX Analyst, comments: "Last week we saw our first contraction in a few weeks, while the year is still running roughly 4% ahead of 2025 traffic levels. As expected, Oshkosh is drawing a surge in bizjet traffic, with the ramp almost 12x the normal occupancy and potentially more jets to come.”
*For this week’s event analysis, WINGX has provided an evaluation of the 2026 AirVenture at Oshkosh using our proprietary AI prompts
Continue reading free
Enter your email to unlock this article and get the WINGX Bulletin delivered to your inbox, weekly.
