
20 August 2026
Global Bizjet Activity
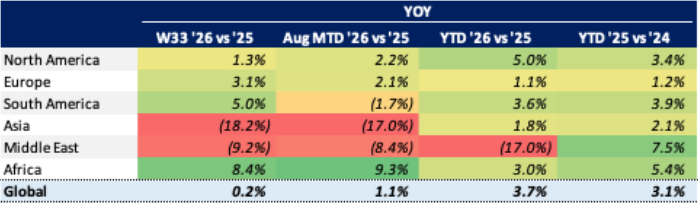
Global bizjet activity was flat in Week 33 (10 – 16 August), just 0.2% ahead of Week 33 2025. The year-to-date figure now sits at +3.7% ahead of last year through 16 August, a 0.1 percentage point decrease from the 3.8% YTD trend through 9 August reported last week. Asia stood out last week as the region with the most notable declines, down 18.2% while accounting for 2% of global activity. On the other hand, Africa saw the strongest gains of any region, up 8.4% while making up just 1% of global traffic.
Chart 1: Global Bizjet Departure Trends YTD (1 January – 16 August)
Almost all of the growth seen this year is being driven by Fractional Operators and Private Flight Departments, with Fractional activity up 10.6% year-to-date through 16 August, while Private activity is up 10.2%. Fractional’s growth is primarily in North America with North American Fractional activity up 11.5% so far this year, while accounting for 85% of global Fractional bizjet activity. NetJets and Flexjet, which make up the vast majority of Fractional flying, have increased both of their fleet sizes roughly 10%, while increasing their flying by approximately the same rate, meaning hours per aircraft are staying about the same. Private Flight Departments on the other hand, have only increased the fleet size by 1%, while hours have increased by 10%, meaning owners are flying their existing aircraft much more.
Chart 2: Global Bizjet Departure Trends YTD (1 January – 16 August) by Operator Type
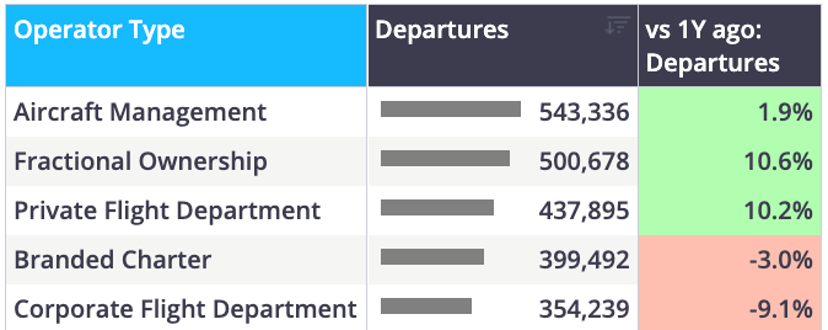
Smaller operator types like Government / Military, Ambulance / Medical, Training and others are excluded from the table above
Regional Performance Analysis in Week 33
North America
The North American market slightly outperformed the global market at +1.3% last week year-on-year, with the US also outperforming that trend at +1.7%, with mixed growth amongst top US states. Texas led with notable growth at 7.4% vs Week 33 2025, followed by Florida at +4.4%, while California contracted 0.8%.
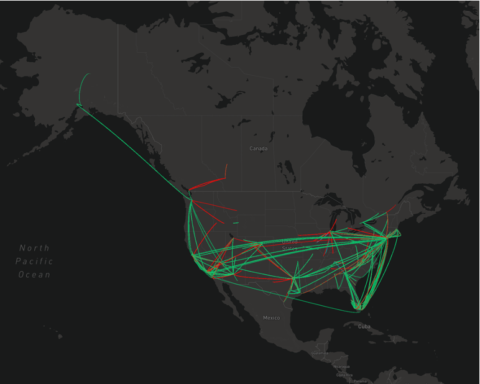
Chart 3: Map of top regional North American airport pairs by business jet departures YTD (1 January - 16 August)
Event Analysis: Golf’s Playoff Opener Runs Hotter Than 2025 At KOLV
*This week’s event analysis compares the 2026 FedEx St. Jude Championship against last year’s event traffic
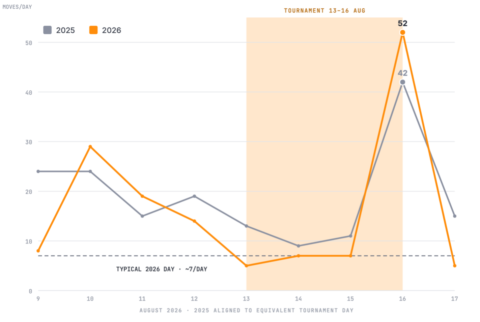
The 2026 FedEx St. Jude Championship (13 – 16 August), which opened the PGA Tour’s FedEx Cup Playoffs at TPC Southwind in Memphis, wrapped up on Sunday. As in 2025, the tournament drove a sharp business jet spike into Olive Branch Airport (KOLV), the general aviation reliever airport beside the course, while Memphis International (KMEM) again barely registered a surge against its baseline. This year’s tournament ran even hotter than last, with traffic once again concentrated on the final round.
Some key observations to note:
- Business jet movements (arrivals + departures) peaked at 52 on the final round Sunday, more than 7 times the normal ~7 movements KOLV handles on a normal day and about 24% above last year’s peak of 42 movements
- Jets on the ground topped 31 that Sunday, essentially level with the 30 seen in 2025
- Fractional traffic was even more concentrated than last year, with NetJets alone flying 59% of all tournament arrivals in KOLV, up from 50% in 2025
- The arriving fleet skewed lighter than last year, with light jets leading at 41% (up from 24% last year) as super midsize jets made up 27% of traffic
Chart 4: Daily business jet movements (arrivals + departures) at Olive Branch Airport (KOLV) for the FedEx St. Jude Championship 2026 vs 2025
Europe
Europe was one of the stronger regions last week, with business jet traffic growing at a rate of +3.1% vs last year, with various growth by top countries. The UK led growth at +4.3%, with Switzerland trailing closely behind with growth of +4.2%, while France saw growth of +2.6%. Italy and Germany realized contractions last week, -2.4% and -4.0%, respectively.
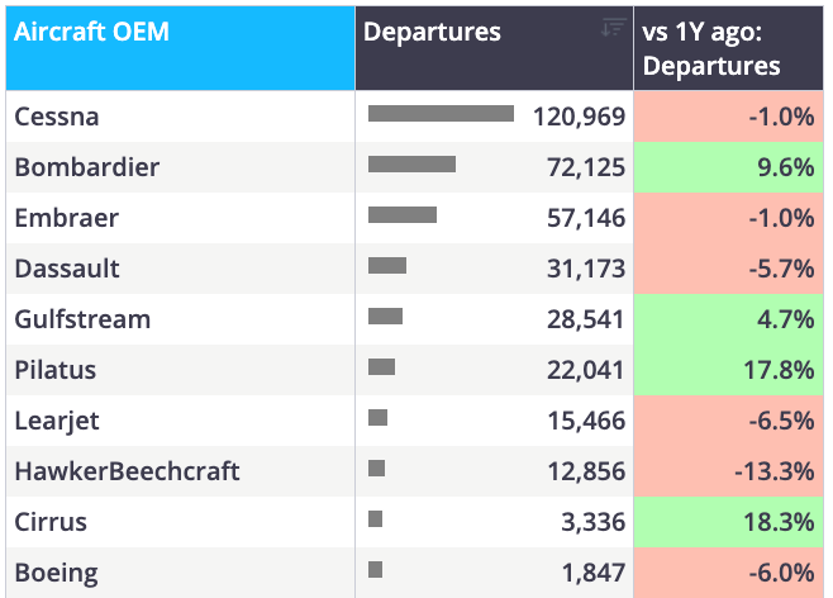
Chart 5: Europe business jet departures by top OEM fleets (1 January – 16 August)
Rest of World
Business jet activity in regions outside of Europe and North America contracted 4.9% on a combined basis in Week 33, with growth being dragged down by Asia and the Middle East, down 18.2% and 9.2%, respectively. Africa realized strong growth of +8.4% last week, while South America trailed behind with solid +5.0% growth.
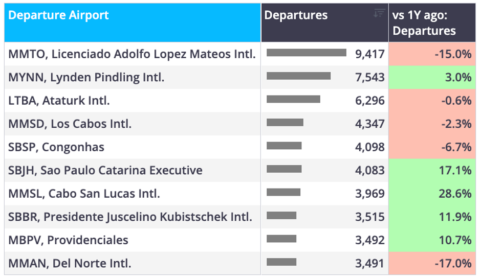
Chart 6: ROW business jet departures by top airports YTD (1 January – 16 August)
Conclusion
While Week 33 growth was flat overall, global bizjets year-to-date are still 3.7% ahead of 2025, so one soft week does not change the overall trajectory, with growth being primarily driven by Fractional Operators and Private Flight Departments. Regionally, growth is increasingly bifurcated, with strong growth out of North America while the US-Israel-Iran conflict continues to suffocate the Middle East bizjet market. Whether the year holds its ~4% growth now depends on how long Fractional and Private operators can carry the rest of the market.
*For this week’s event analysis, WINGX has provided a comparison of the 2026 and 2025 FedEx St. Jude Championships using our proprietary AI prompts
Continue reading free
Enter your email to unlock this article and get the WINGX Bulletin delivered to your inbox, weekly.
