
22 October 2026
Global Bizjet Activity
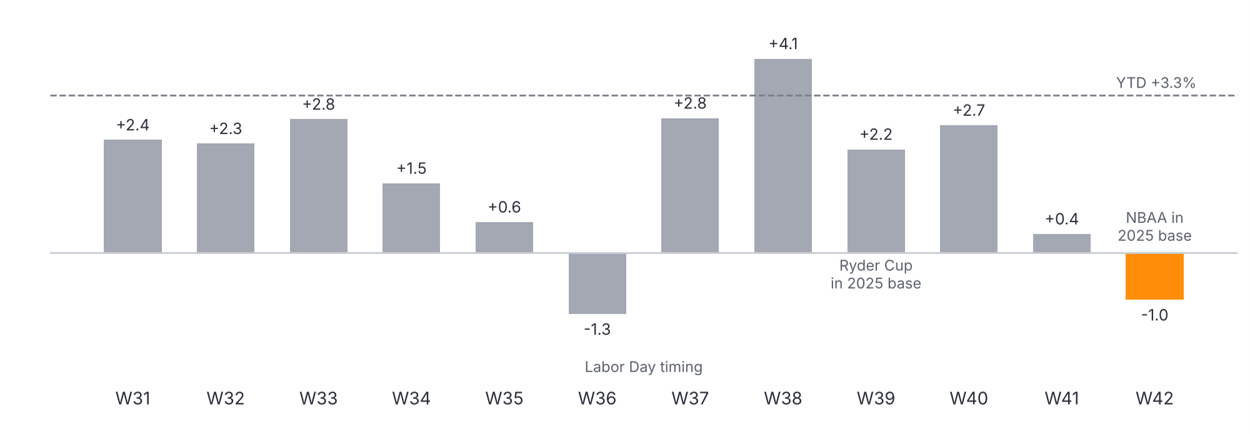
Global bizjet activity eased 1.0% year-on-year in Week 42 (12 – 18 Oct), with over 83,300 departures operated globally. This was the first weekly decline since the Labor Day timing shift pulled Week 36 negative, and the four-week trend has slowed to +1.0%. The year-to-date figure holds at +3.3% ahead of last year through 18 October. North America slipped 1.3% and Europe 1.0%, while Central America (-26.7%) and the Middle East (-13.7%) remained the weakest regions. On the positive side, Asia was up 17.7% and South America 14.1%.
What Drove the Week
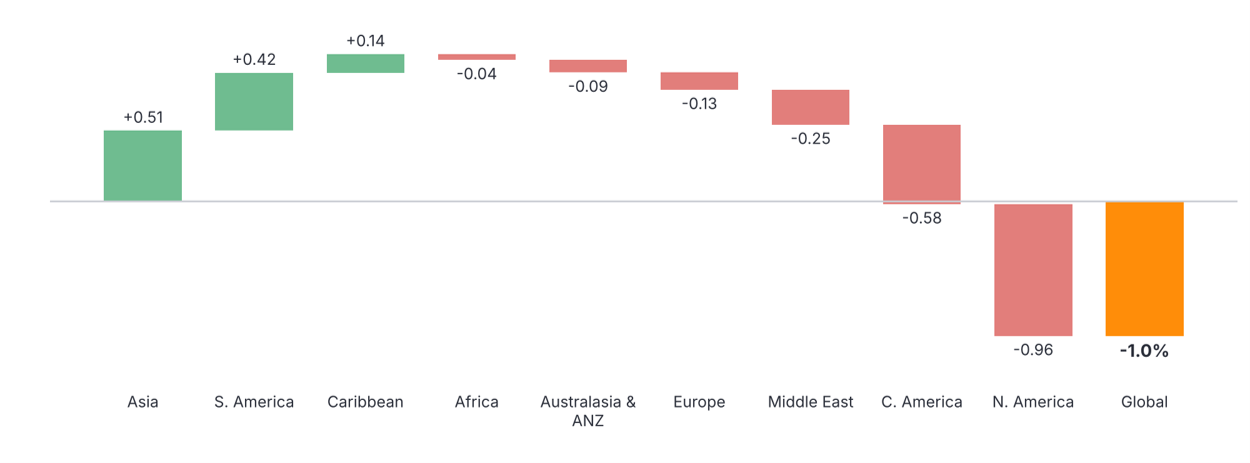
The chart below breaks global growth down by sub-region. North America took 0.96 points off global growth and Central America a further 0.58 points, while Asia (+0.51 points) and South America (+0.42 points) offset about half of the decline. Part of North America’s weakness reflects last year’s NBAA-BACE convention in Las Vegas, which inflated the comparison week: excluding Nevada, global departures were down 0.6%.
Chart 1: Contribution to global bizjet departures YOY growth by sub-region (Week 42 2026 vs Week 42 2025)
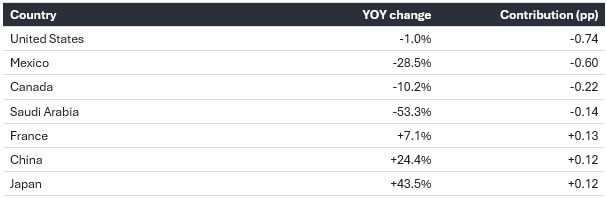
While growth rates alone can overstate smaller markets, the table below ranks the week’s biggest country movers by their contribution to global growth. The United States, down 1.0%, and Mexico, down 28.5%, were the largest drags, while France, China and Japan led the gains.
Table 1: Biggest country movers, Week 42 (12 – 18 Oct)
Trend Context
The chart below puts Week 42 in context. Weekly year-on-year growth held largely in a 2–4% range through the summer and early autumn, but the last two weeks have run well below that. Week 42 2026 was 1.6% busier than Week 41, while the same week in 2025 rose 3.0% on its prior week, helped by NBAA-BACE. The pattern within the week also changed: Tuesday to Thursday, the core days of last year’s convention, fell 2.8%, while the weekend grew, with Saturday up 3.9%, after two soft weekends.
Chart 2: Global business jet departures, YOY % change by week (Weeks 31 – 42, 2026 vs 2025)
Regional Performance Analysis in Week 42
Table 2: Bizjet departures by sub-region, Week 42 and year-to-date (1 January – 18 October)
|
Sub-Region |
W42 departures |
W42 YoY |
YTD YoY |
|
North America |
61,103 |
-1.3% |
+4.5% |
|
Europe |
11,030 |
-1.0% |
+1.3% |
|
Asia |
2,879 |
+17.7% |
+2.1% |
|
South America |
2,867 |
+14.1% |
+13.4% |
|
Middle East |
1,352 |
-13.7% |
-14.1% |
|
Central America |
1,338 |
-26.7% |
-17.9% |
|
Caribbean |
969 |
+13.3% |
+9.2% |
|
Africa |
925 |
-3.7% |
+6.3% |
|
Australasia & ANZ |
725 |
-9.6% |
-4.3% |
North America
The North American market slipped 1.3% year-on-year last week, with just over 61,100 departures. The United States accounted for roughly 97% of North American flights (and around 71% of all global departures) with 59,370 flights, down 1.0%, while Canada fell 10.2%. Nevada was the biggest single drag, down 21.8%: movements at Las Vegas’ three airports fell 20.5%, with the steepest declines on the Monday and Thursday, likely last year’s NBAA arrival and departure days. Alabama (-25%), Indiana (-17%), Kentucky (-17%) and Illinois (-7.4%) were also weak, while Florida (+3.5%), North Carolina (+8.2%) and Massachusetts (+7.8%) grew. On a year-to-date basis, North America remains the anchor of global growth, up 4.5%.
Europe
European business jet traffic eased 1.0% year-on-year in Week 42 with just over 11,000 flights, and its year-to-date trend sits at +1.3%. France led the top markets, up 7.1%, followed by Switzerland (+6.3%) and Italy (+2.0%). In contrast, the UK slipped 3.3% and Spain 4.7%, while Sweden, Austria and Greece fell sharply on smaller bases.
Rest of World
Outside Europe and North America, trends were sharply split. Asia and South America led, up 17.7% and 14.1% respectively, with Venezuela (+65%), Colombia (+57%) and Argentina (+25%) driving South American growth. The Caribbean rose 13.3%. Australasia & ANZ fell 9.6%, with Australia down 11.0%, and Africa slipped 3.7%.
In the Middle East, Gulf departures fell back to 513 from 552 the previous week, and the gap to last year widened to -30.5%, with Saudi Arabia down 53% and the UAE 26%. Turkey rose 2.3%. Mexico fell 28.5%, its steepest decline of the past month, with flights by US-registered jets down 38.6% and Mexican-registered jets down 21.6%.
Mover of the Week: Asia
Asian business jet departures reached 2,879 in Week 42, the highest weekly total of 2026 and 17.7% above the same week last year. This breaks a soft run for the region: Asia was 9% below 2025 levels through the summer months (Weeks 27 – 33) and broadly flat in early October.
Chart 3: Weekly business jet departures from Asia, Weeks 2 – 42, 2025 vs 2026
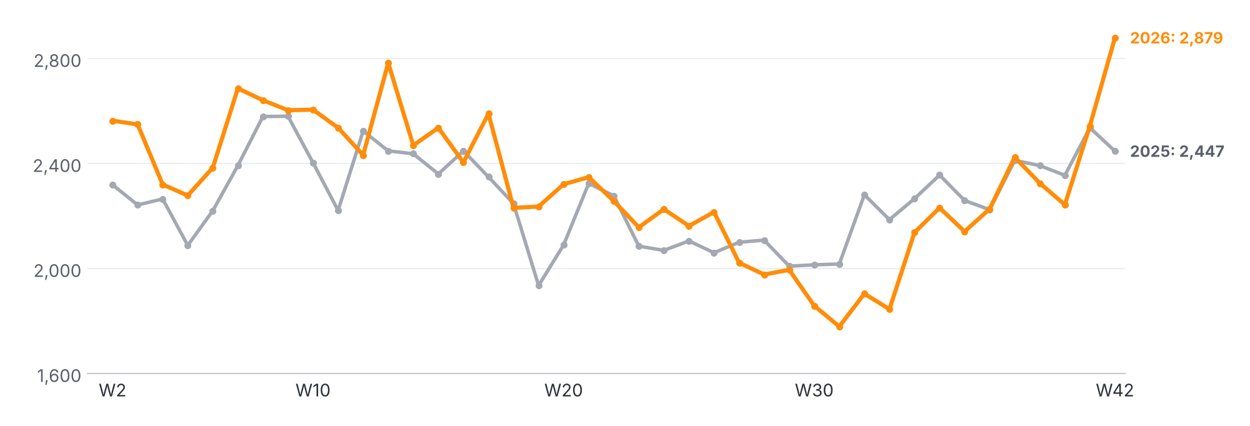
The gains were broad across the region’s larger markets, led by Japan (+43.5%), Singapore (+61.7%) and China (+24.4%), with India, the region’s busiest market, up 10.8%. However, one strong week does not make a trend, and the coming weeks will show whether this marks a genuine pickup in Asian demand. Year-to-date, Asia is up 2.1%.
Table 3: Bizjet departures from Asia’s largest markets, Week 42 2026 vs Week 42 2025
|
Country |
W42 2026 |
W42 2025 |
YOY change |
|
India |
808 |
729 |
+10.8% |
|
China |
536 |
431 |
+24.4% |
|
Japan |
340 |
237 |
+43.5% |
|
Singapore |
186 |
115 |
+61.7% |
|
Indonesia |
132 |
102 |
+29.4% |
Who Is Flying
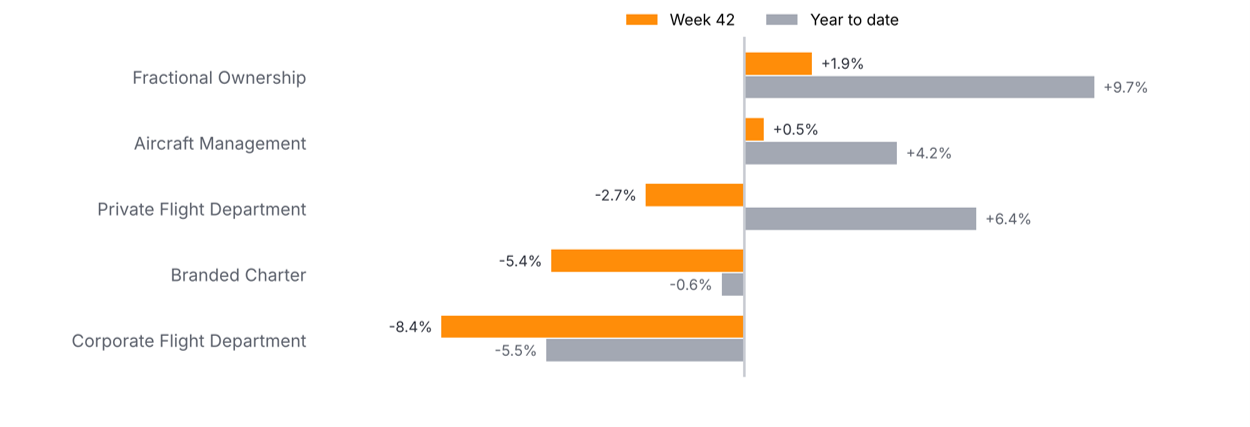
Only fractional operators (+1.9%) and aircraft management companies (+0.5%) grew in Week 42. Corporate flight departments fell 8.4%, branded charter 5.4% and private flight departments 2.7%. Year-to-date, fractional activity remains the strongest segment, up 9.7%, followed by private flight departments (+6.4%) and aircraft management (+4.2%), while corporate flight departments are down 5.5% and branded charter 0.6%.
Chart 4: Business jet departures YOY % change by operator type, Week 42 and year-to-date (1 January – 18 October)
Fleet Lens
Combining WINGX flight data with JETNET fleet records shows that more jets flew in Week 42, but each flew less. The number of active jets rose 1.3%, while departures per active jet fell 2.2% and flight hours per jet 1.4%, leaving total flight hours essentially flat. The number of jets listed for sale has edged up for three consecutive weeks, to 1,751.
Table 4: Business jet fleet and utilisation, Week 42
|
Measure |
Value |
vs last year |
|
Business jets in service (JETNET) |
25,741 |
– |
|
Jets that flew in Week 42 |
13,960 (54.2% of fleet) |
+1.3% |
|
Departures per active jet |
5.96 |
-2.2% |
|
Flight hours per active jet |
9.9 |
-1.4% |
|
Active airframes, year-to-date |
22,975 |
+2.5% |
|
Jets for sale (JETNET) |
1,751 (6.8% of fleet) |
– |
|
New listings, Week 42 (JETNET) |
53 |
– |
Looking Ahead to Week 43
- Asia: the coming weeks will show whether Week 42’s surge holds or proves to be a one-week effect.
- Fourth quarter: comparisons stay tough through November, when growth reached +9.4% in 2025.
Conclusion
Nick Koscinski, WINGX Analyst, comments, “Global activity slipped 1% last week, the first decline since Labor Day, though some of that is simply last year’s NBAA show in Las Vegas sitting in the comparison. Strip out Nevada and we’re down about half a percent, with Mexico still the biggest drag. On the positive side, Asia had its busiest week of the year, up almost 18%, and South America keeps growing at double digits.”
Note: Figures cover business jets including VIP/bizliner aircraft. All figures exclude turboprops.
