
16 September 2026
Global Bizjet Activity
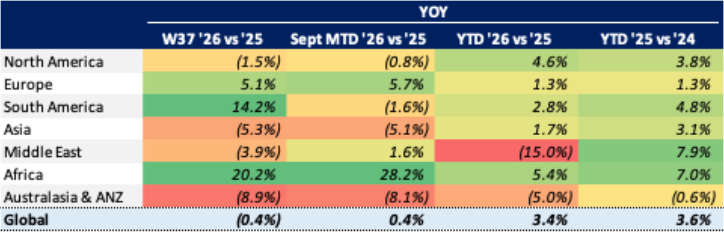
Global bizjet activity was flat in Week 37 (7 – 13 Sept), with the year-to-date figure at +3.4% ahead of last year through 13 September, now 0.2 percentage points below the trend for the same dates in 2025 vs 2024. While accounting for 70.1% of global bizjet traffic last week, North America declined 1.5%, while South America and Africa both experienced significant double-digit gains, up 14.2% and 20.2% respectively.
Chart 1: Global bizjet departures trend YTD (1 January – 13 September)
Regional Performance Analysis in Week 37
North America
The North American market underperformed the global market for a second consecutive week, declining 1.5% last week year-on-year, with the US performed slightly better than this trend at -1.3%. Weekly year-on-year growth on a key state level was a mixed bag, with Florida up 9.5%, Texas up 3.1%, while California was down 8.2%.
The below table ranks North America’s bizjet departures by aircraft segment on a year-to-date basis (1 January – 13 September), showing both volume and year-on-year change. Light Jets remain the region’s highest-volume segment at 529,889 departures, while Ultra Long Range (+10.6%) and Midsize (+8.2%) jets are the fastest-growing.
Chart 2: North America bizjet departures trend by aircraft segment YTD (1 January – 13 September)

Narrowing down to the region’s busiest segment, this table shows the top operators ranked by light jet activity only, YTD. Major fractional and managed-fleets lead activity, with NetJets well ahead at 74,835 light jet departures (+19.9%) and Flexjet a distant second with just 31,340 light jet departures (+3.6%).
Chart 3: North America bizjet departures trend by operators’ light jet activity only YTD (1 January – 13 September)

Europe
In Week 37, Europe’s business jet traffic expanded 5.1% vs last year, while its YTD trend remains at a sluggish +1.3%, and all top countries, except Germany, saw year-on-year gains last week across Europe. France led growth at 8.5%, followed by Switzerland’s 6.4% gains, with the UK up 4.8%. Italy was relatively flat, up just 0.3%, while Germany was 1.5% below Week 37 2025 levels.
This table ranks Europe’s bizjet departures by aircraft segment on a YTD basis by volume and year-on-year change. Light Jets lead on volume at 96,906 departures but are down 3.8%, with Super Light (+6.5%) and Super Midsize (+6.2%) jets carrying the region’s segment growth.
Chart 4: Europe bizjet departures trend by aircraft segment YTD (1 January – 13 September)

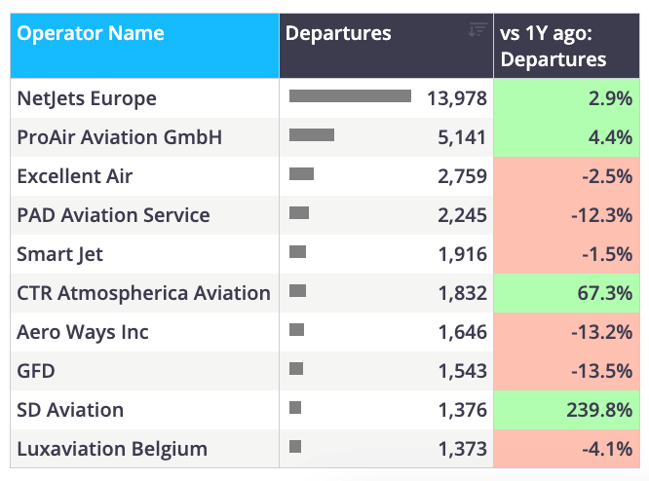
Drilling into the top segment, this table lists Europe’s leading operators of light jets only, YTD. NetJets Europe dominates with 13,978 departures, roughly three times its nearest competitor, with the rest of the field made up of smaller regional operators.
Chart 5: Europe bizjet departures trend by operators’ light jet activity only YTD (1 January – 13 September)
Rest of World
Business jet activity in regions outside of Europe and North America expanded 5.0% on a combined basis in Week 37, with diverging trends on a sub-region basis. South America and Africa were the star performers last week, a seemingly recurring trend, up 14.2% and 20.2% respectively. In contrast, the Middle East was down 3.9%, Asia was down 5.3%, and Australasia & ANZ was down 8.9%.
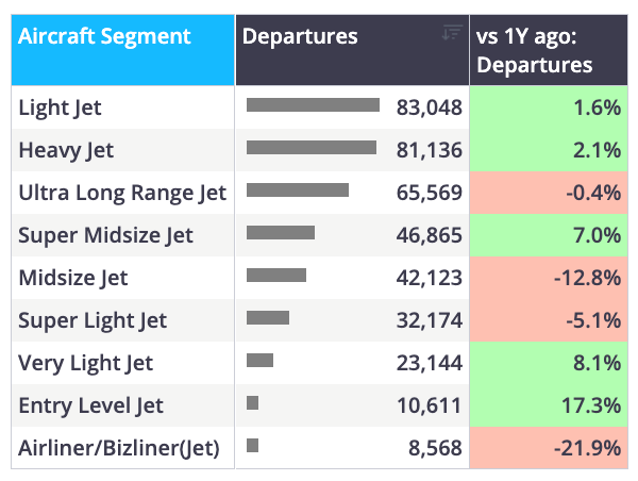
This table ranks bizjet departures outside of North America and Europe by aircraft segment YTD. Light Jets (83,048) and Heavy Jets (81,136) have flown at nearly the same levels this year, while Midsize Jets are the weakest major segment, down 12.8%.
Chart 6: Rest of World bizjet departures trend by aircraft segment YTD (1 January – 13 September)
Focusing on the region’s largest segment, this table shows the top light jet operators across Rest of World markets, YTD. NetJets again leads at 1,377 departures, followed by a mixed field of Latin American and Asian operators.
Chart 7: Rest of World bizjet departures trend by operators’ light jet activity only YTD (1 January – 13 September)

Conclusion
Nick Koscinski, WINGX Analyst, comments, “Global bizjet activity was flat last week, with the year-to-date figure holding steady at +3.4%, although this year-to-date trend is now slightly behind where we were at this point last year. The emerging markets of South America and Africa continue to see significant growth, which has become a recurring trend in recent weeks.”
What’s New? (2026)
August
Want to dig deeper into these insights and scale your business with confidence?
WINGX is the global online aviation insights solution that helps professionals understand business aviation activity, benchmark their performance, and spot change across the industry.
Recent Platform Improvements:
Self-serve Dashboard
Present the air insight data you need in the way you know best with Self-serve Dashboard.
- Customize with graphs, tables, and text boxes
- Multiple layout options available
- Export your dashboard as a PDF or PowerPoint
For more information, see this article.
Note: This is available for Air Insight customers only.
