
27 August 2026
Global Bizjet Activity
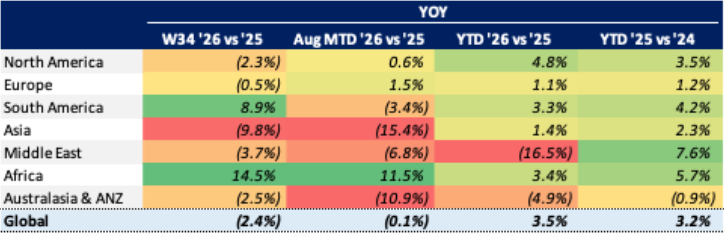
Global bizjet activity contracted 2.4% in Week 34 (17 – 23 August), with the year-to-date figure now at +3.5% ahead of last year through 23 August, 0.3 percentage stronger than the trend for the same dates in 2025 vs 2024. For the second consecutive week, Asia stood out last week as the region with the largest declines, down 9.8% while accounting for 3% of global activity. Airports in Africa saw the strongest gains in bizjet activity of any region, up 14.5% YOY while making up just 1% of global traffic.
Bizjet activity this summer has been the busiest on record at WINGX, with a total of nearly 947,000 bizjet departures up 2.3% vs the summer at this point last year (1 June – 23 Aug 2025), and up 35.0% compared to the same dates in 2019.
Chart 1: Global Bizjet Departure Trends YTD (1 January – 23 August)
The waterfall chart below breaks down the global +3.5% YTD growth trend in business jet departures into each region’s weighted contribution (its share of traffic multiplied by its YTD growth rate). North America, at 71.1% of all activity and up 4.8% accounts for +3.4 points of that gain, continuing to serve as the global growth engine for bizjet traffic. Every other growing region adds only a fraction of a point, while the Middle East is the sole meaningful drag, with its 16.5% YTD decline and 1.7% share of traffic subtracting 0.3 points from the global trend.
Chart 2: Weighted contribution* of global YTD growth (1 January – 23 August)
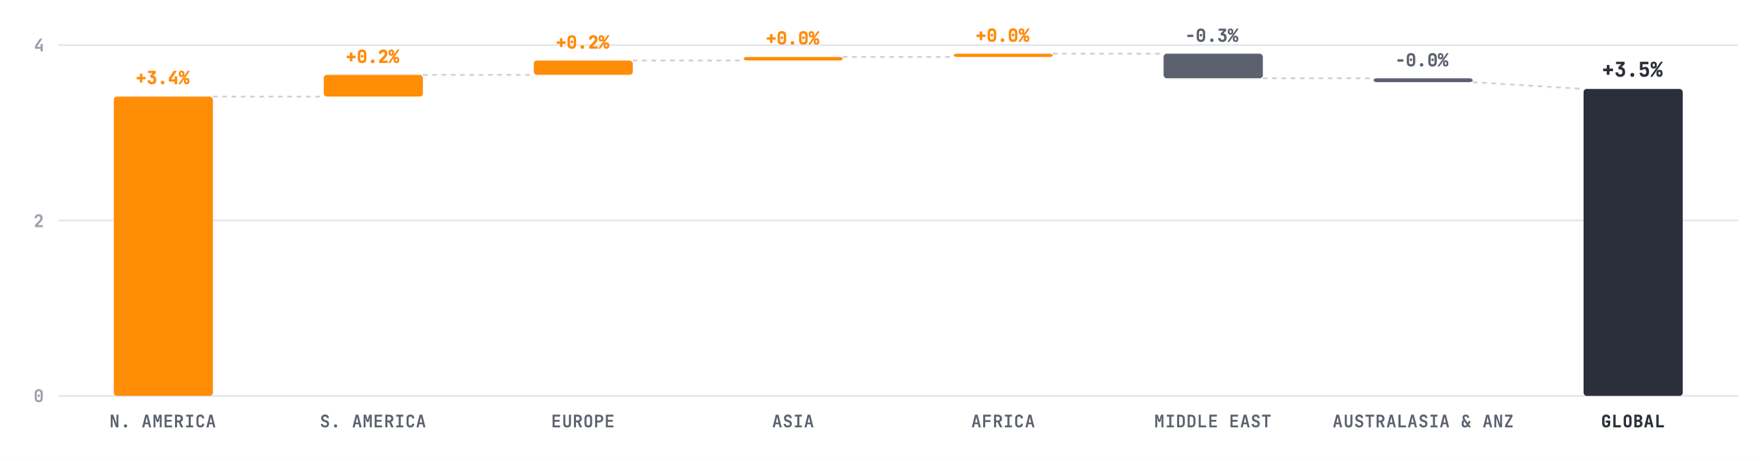
*Contribution = regional share of global traffic multiplied by its YTD growth rate
Regional Performance Analysis in Week 34
North America
The North American market performed broadly in line with the global market at -2.3% last week year-on-year, with the US slightly performing better at a contraction of 1.7%, with growth varying by region. Airports in Texas saw 1.6% growth in bizjet flight activity vs Week 34 2025, while activity in Florida contracted 2.1%, and California declined 5.4%.
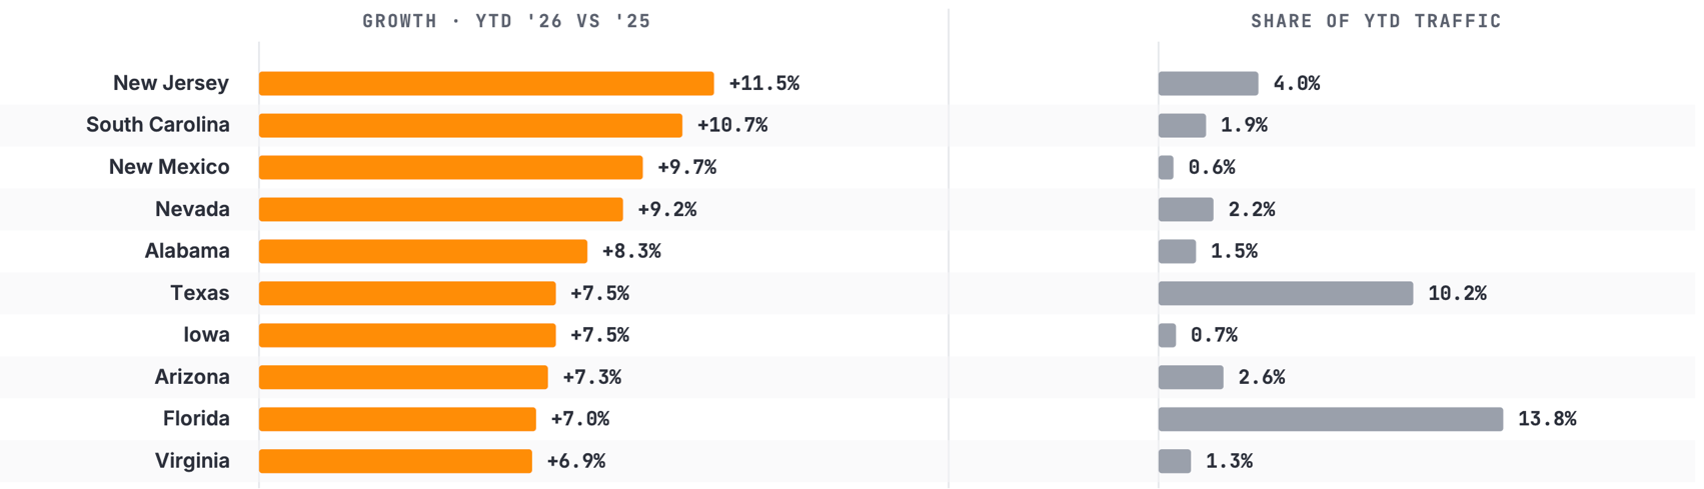
The ranking chart below shows the fastest growing US States by year-to-date departures, alongside each state’s share of total US traffic. New Jersey (+11.5%) and South Carolina (+10.7%) lead growth so far this year, yet only account for a combined 5.9% of US activity. On the other hand, Texas and Florida, which make up nearly a quarter of US departures, are seeing more modest gains of 7.5% and 7.0%, respectively.
Chart 3: Top US states by YTD growth (1 January – 23 August)
Operator Case Study: Top Operators’ Hours Per Aircraft
Utilisation (hours per aircraft) is holding steady across the global fleet in 2026. The roughly 25,800 business jets tracked year-to-date (1 Jan – 23 Aug) each flew an average of 163 hours, up 1% compared to the same dates in 2025, while this workload is quite split between the world’s two most mature bizjet markets. In North America, bizjets averaged 140 hours each over the period, a 3% year-on-year increase, while in Europe, bizjets flew just 89 hours per unit, down 1% compared to last year.
Chart 4: Top operators’ utilisation (hours per aircraft) YTD growth (1 January – 23 August)
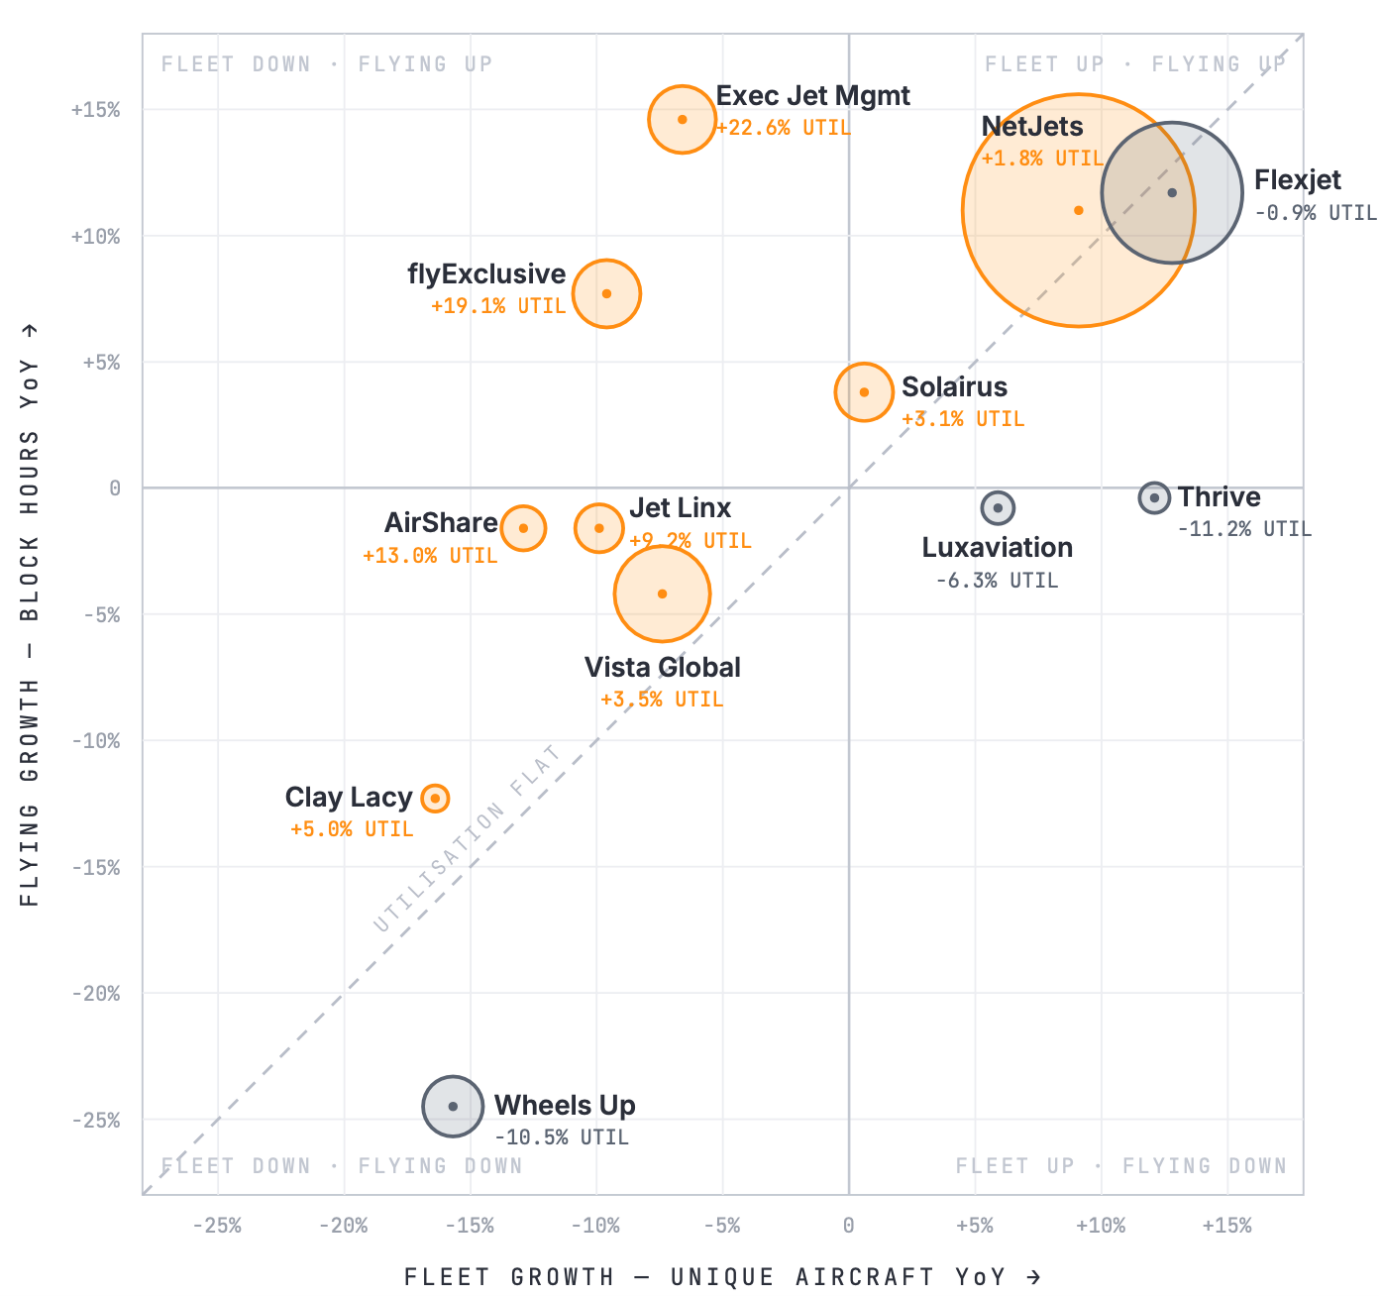
Size of bubble refers to number of YTD departures
Europe was relatively flat last week, with business jet traffic contracting 0.5% vs last year, with mostly declines by top countries. France was the only top country not to see decline in bizjet deps in W34, . Bizjet flights from Italy declined 1.1%, followed by Germany at -1.2%, then Switzerland at -5.0%, finally with the UK farthest behind at -6.6%.
Zooming out, Europe’s flatness has been seen throughout most of this year, rather than just a one-week wobble. Europe is up just 1.1% year-to-date, and that thin gain is almost entirely down to Italy and Spain, which together account for almost all of the region’s growth. If you were to exclude Italy and Spain’s growth, the rest of the region is completely flat. The reason the region can’t break above 1% is that the other core countries are slightly behind 2025 levels. France, the UK, and Germany, which make up 40% of the region’s traffic, are collectively down 0.7%.
The table below ranks European countries by year-to-date departure growth with its share of European regional traffic. Growth is concentrated in small emerging markets, led by Moldova with 35.2% growth this year, while accounting for very little of Europe’s total bizjet activity. The countries that carry most of Europe’s traffic are seeing a mixed bag in growth trends year-to-date, with Italy at +4.3% while Germany down 2.7%.
Chart 5: Select** European countries by YTD growth (1 January – 23 August)
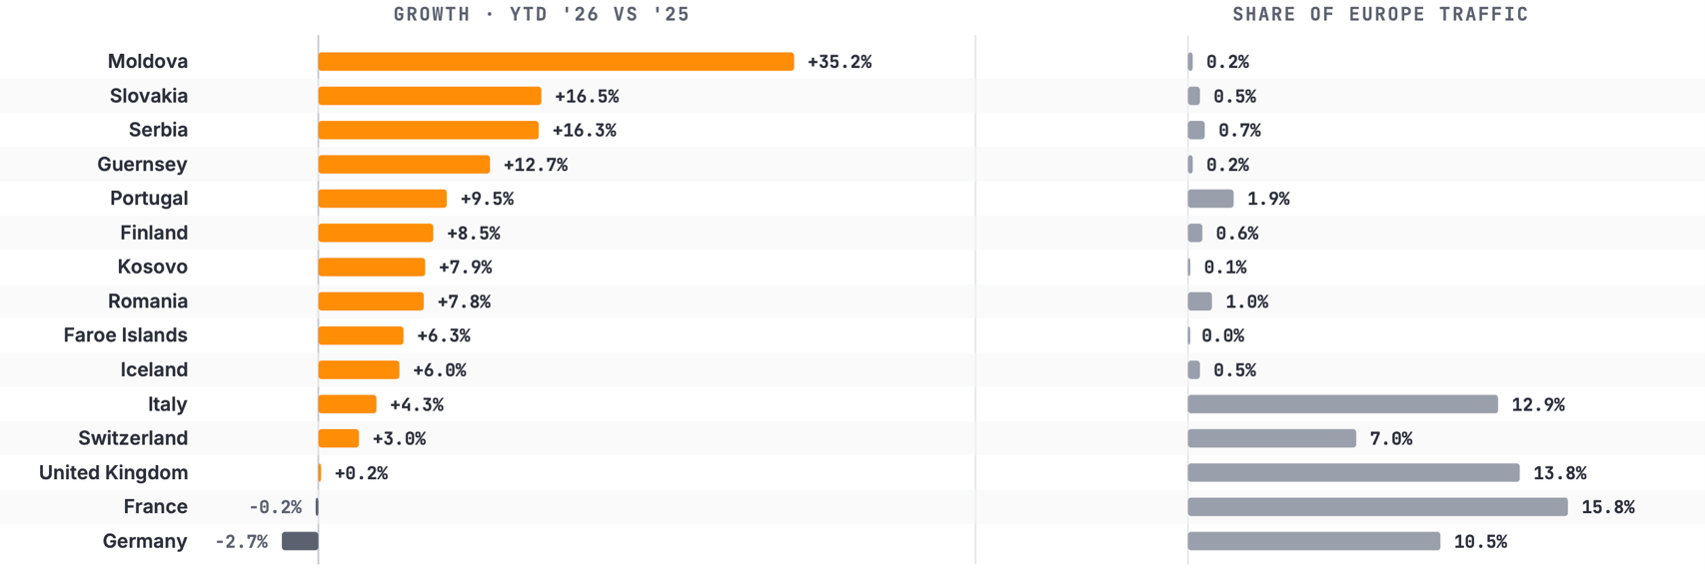
**Countries selected based on highest growth so far this year, alongside countries with highest share of traffic
Rest of World
Business jet activity in regions outside of Europe and North America expanded 1.1% on a combined basis in Week 34, with growth being driven by Africa and South America, up 14.5% and 8.9%, respectively. In contrast, the Middle East was down 3.7% last week year-on-year, and Asia was down a notable 9.8%.
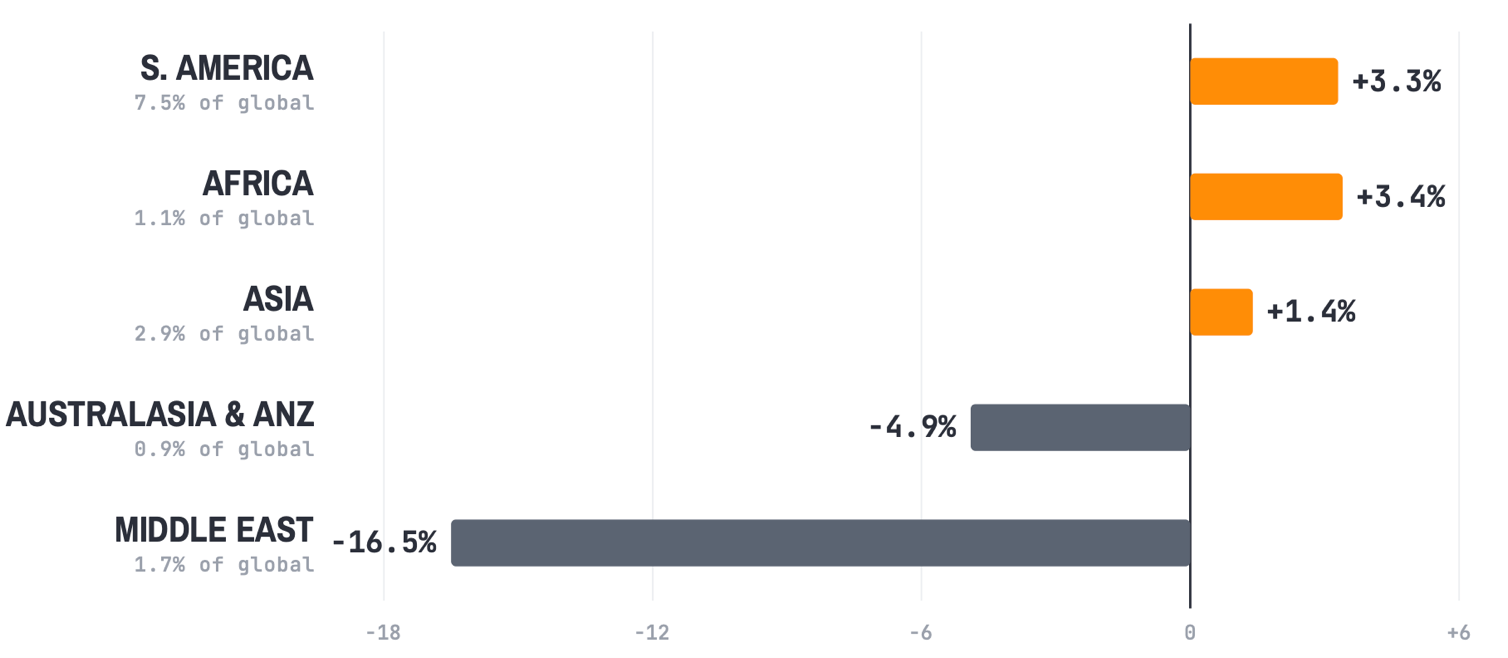
Rest of World growth in bizjet activity so far this year is primarily concentrated in South America and Africa, both regions seeing 3% growth compared to 2025, , while Rest of World traffic overall makes up roughly 13% of global traffic. The drop in bizjet demand in the Middle East since the Iran war is the most notable drag on global growth, bizjet flights down 16.5% this year, with the region’s ongoing activity accounting for 1.7% of global bizjet activity.
Chart 6: ROW regions YTD growth in flights (1 January – 23 August YOY)
Nick Koscinski, WINGX Analyst, comments, “Week 34’s 2.4% contraction belies the year-to-date trend, still at a healthy 3.5% ahead of 2025 levels. That said, since mid-year we are seeing an increasing number of declining weeks, which may reflect emerging concerns around the global economy, notably persistent inflation and geopolitical risk.”
